Epigenome-wide association study
A workflow that runs EWAS analyses to identify ALL-associated differentially methylated CpG positions on autosomal chromosomes. We fitted a logistic regression model predicting ALL case/control status as a function of DNA methylation at each remaining CpG, adjusting for sex, batch effect, cell type heterogeneity using the first 10 principal components derived from ReFACTor (58) and genetic ancestry using the first 10 principal components derived from EPISTRUCTURE. Fixed-effect meta-analysis models were used to generate summary effect estimates for the EWAS results of the CpGs overlapping hree different study sets—using the R package ‘metafor’.
Study publication: link
EWAS script: link
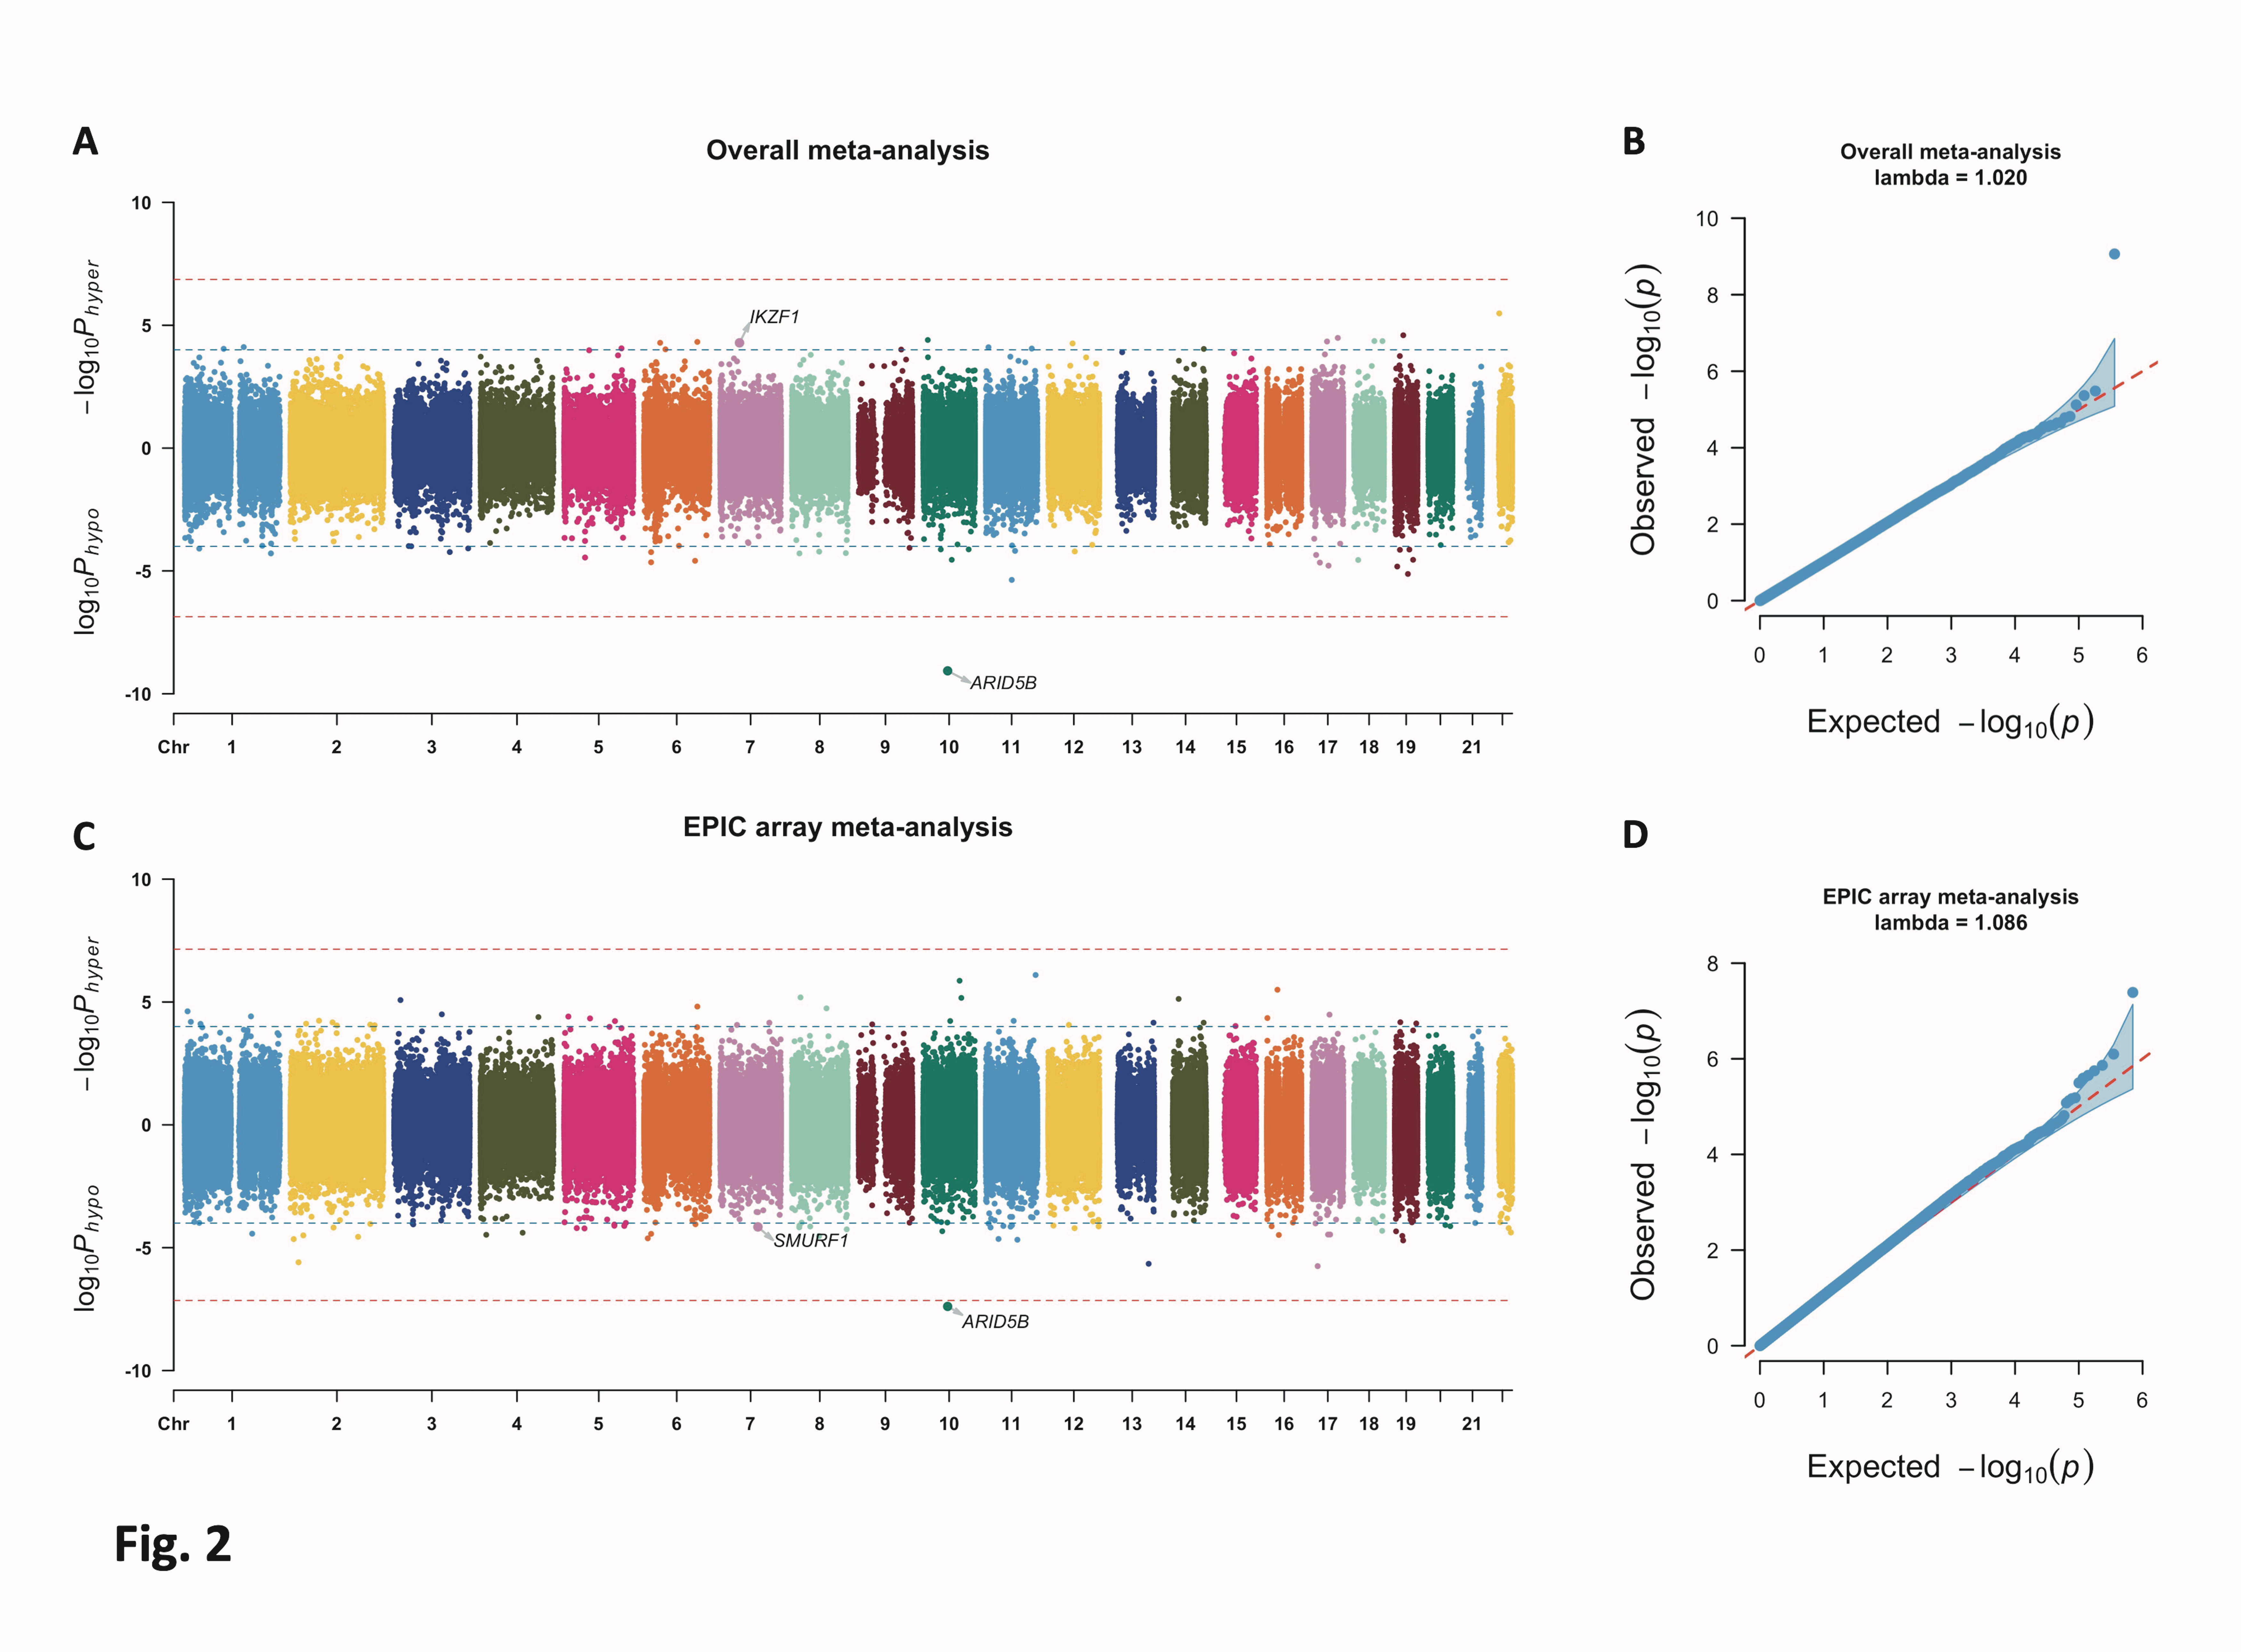
Scripts for Bidirectional Manhattan plot and QQ plot link
Sample plots generated by
CMplot.Rmd:
Bidirectional Manhattan plot and QQ plot for the overall meta-analysis. Two horizontal lines in the Manhattan plot are a Bonferroni-adjusted threshold of 0.025 divided by the number of CpGs (solid line) and a lenient threshold of 1 × 10⁻⁴ (dash line). Y-axis for the Bidirectional Manhattan plot represents −log10Phyper for hypermethylated CpGs (higher DNA methylation beta values in cases versus in controls) and log10Phypo for hypomethylated CpGs (lower DNA methylation beta values in cases versus in controls), respectively. CpGs later included in the causal mediation analysis are labeled with gene names.
