Meta analysis forest plot
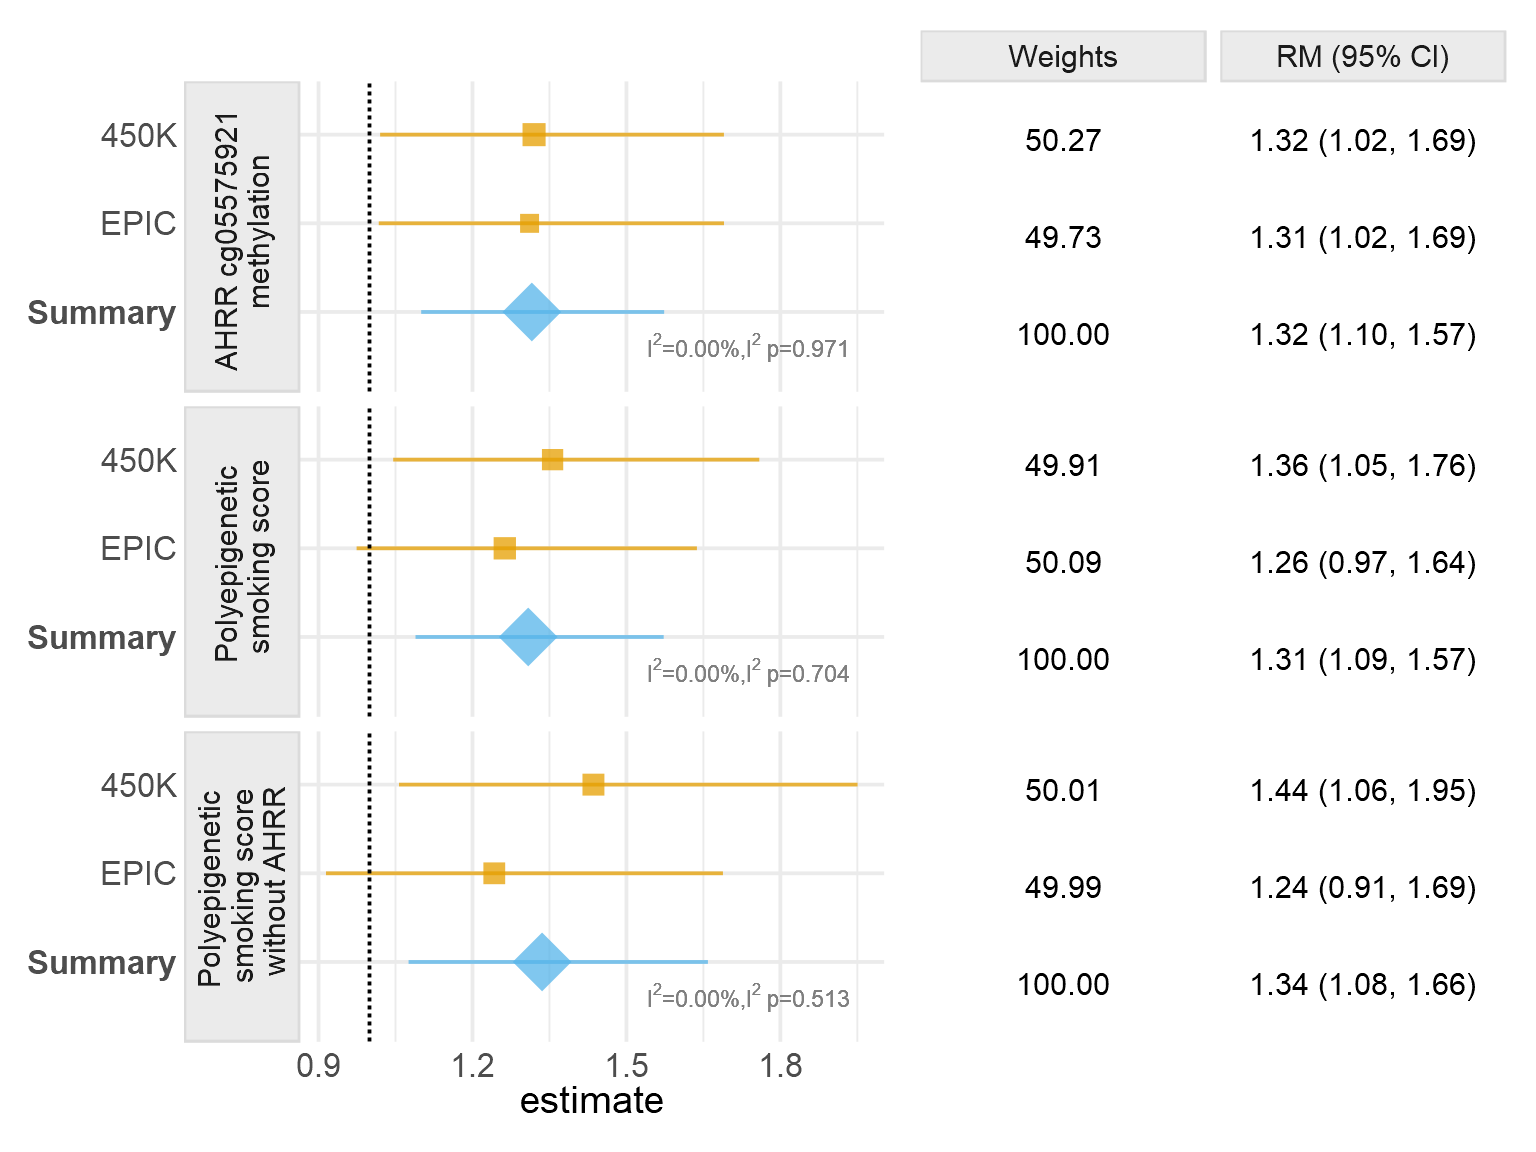
This is a script to create a meta analysis forest plot. The forest plots show meta-analysis results of the association between epigenetic biomarkers of prenatal tobacco smoke exposure and gene deletion frequency in B-ALL cases. The panels include Poisson regression results for the association between deletion numbers and DNA methylation at the AHRR CpG cg05575921 (top), the polyepigenetic smoking score (middle), and the polyepigenetic smoking score excluding AHRR CpG cg05575921 (bottom). Ratio of means (RM) was calculated for every 0.1 b value decrease of cg05575921 and every 4-unit increase of polyepigenetic smoking score. All Poisson regression models were adjusted for cell-type heterogeneity and genetic ancestry. Models with exposure variable DNA methylation at the AHRR CpG cg05575921 were additionally adjusted for methyl-QTL SNP genotypes (rs148405299 in the 450K dataset and rs77111113 in the EPIC dataset). Centers of squares and horizontal bars through each indicate point estimates and 95% CIs of individual set RM. Area of squares indicates relative weights of individual set. Vertical apices of diamonds and horizontal bars through each indicate summary RM and 95% CI. Relative weights (%) (proportional to the reciprocal of the sampling variance of the individual set) of two sets, RM, sRM, and 95% CI are summarized in the right panel.
