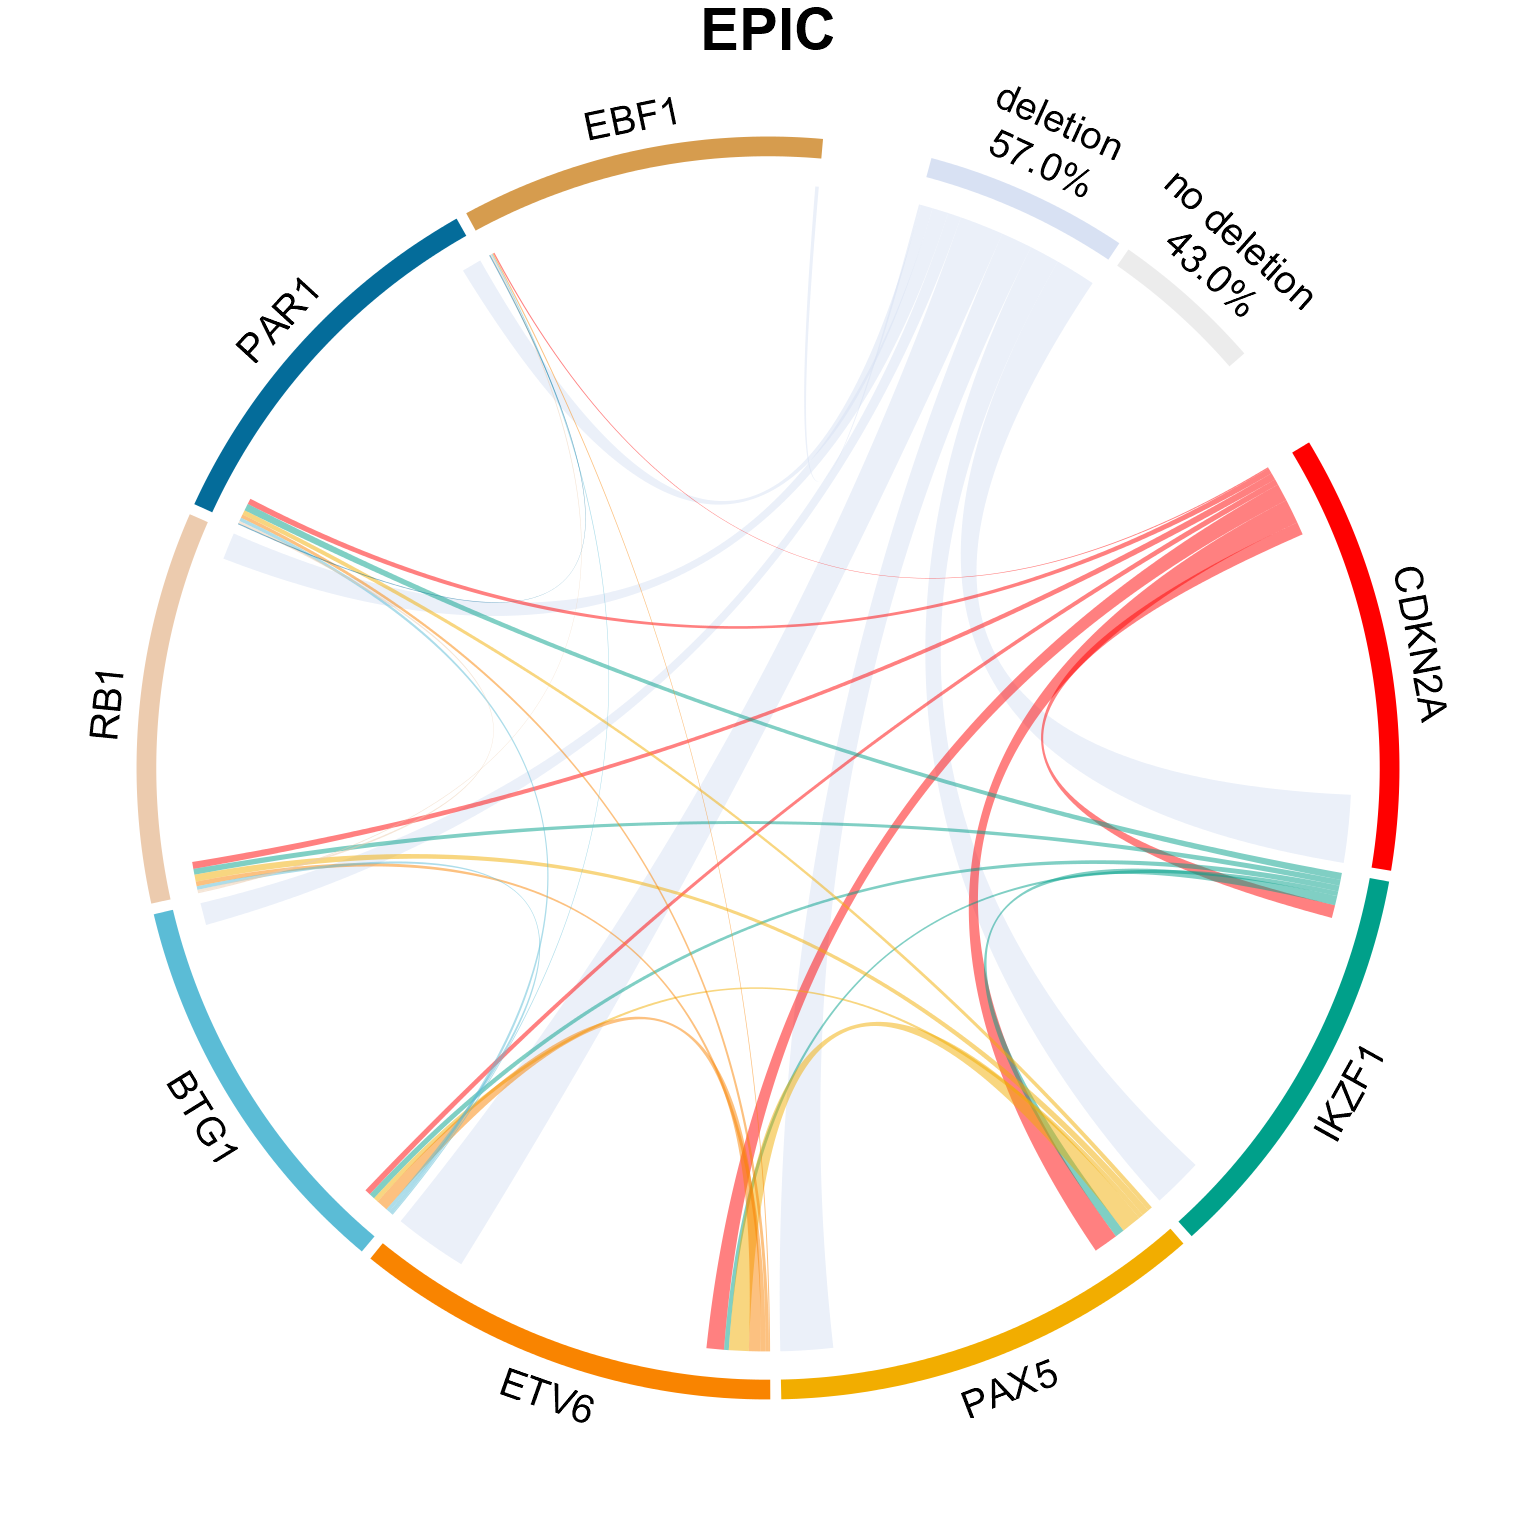
Chord diagram
This is a script that generates a chord diagram to show the number of gene deletion of gene deletion frequency at eight commonly deleted gene regions [CDKN2A, ETV6, IKZF1, PAX5, BTG1, EBF1, RB1, and genes within the pseudoautosomal region (PAR1) of the sex chromosomes (CRLF2, CSF2RA, IL3RA)]. They were assayed in tumor DNA using multiplex ligation-dependent probe amplification (MLPA). The chord diagram shows the proportions of cases with at least one deletion and cases with zero deletions in the EPIC array (N=284) datasets. Width of the end of each link is proportional to the number of deletions of each gene. Width of the link between two genes is proportional to the number of cases having both genes deleted. Diagrams were created using R package circlize.
